Admission Rate
| Definition |
|---|
|
Percentage of applicants offered admission. |
| Data Cookbook URL (requires authorization) |
| https://uwmadison.datacookbook.com/institution/terms/174160/versions/204769 |
| Data Domain(s) |
| Student Record |
Related Dashboards
| Name | Type | Description | Responsible Office | Data Domain | Classification | Access Restrictions | Last Updated |
|---|---|---|---|---|---|---|---|
|
|
Additional Info | 07/20/2026 | |||||
|
Graduate Program Profiles - Admissions & Enrollment
|
Interactive Data Visualization | This data visualization reports summary information on UW-Madison graduate program admissions and enrollment for the past five academic years. It includes data on admissions selectivity and yield rates, the demographics of applicants and enrolled students, as well as the home state or country of enrolled students. The visualization provides the same information as the Graduate School Admissions & Enrollment Data Visualization, but using a Universal Program filter, so that custom links can be created that are Plan/Named Option specific. Additional Info | Graduate School Office of Academic Analysis, Planning, & Assessment | Admissions, Student Record | Public | Publicly Available | 08/15/2024 |
|
Graduate Program Profiles - Graduate Student Funding
|
Interactive Data Visualization | This data visualization provides information about the financial support of graduate students at UW-Madison, including the percentage of fully funded students, their funding appointment types, and average monthly stipend levels. The data visualization utilizes a Universal Program filter. Additional Info | Graduate School Office of Academic Analysis, Planning, & Assessment | Financial Aid, Student Record | Public | Publicly Available | 10/14/2024 |
|
Graduate Program Profiles - Doctoral Career Outcomes
|
Interactive Data Visualization | This data visualization provides information on the early, mid, and late career outcomes of UW-Madison doctoral program alumni using a Universal Program filter. Reported data include employment status, job sector and location, and jobs in academia. Additional Info | Office of Academic Analysis, Planning and Assessment - Graduate School | UW Madison Enterprise | Public | Publicly Available | 10/14/2024 |
|
Graduate Program Profiles - Completion & Degrees
|
Interactive Data Visualization | This data visualization reports summary information on UW-Madison graduate program degrees, time-to-degree, completion rate, retention rate, and completion over time for the past four three year cohorts of Master's and Doctoral students. It includes breakdown by sex, citizenship status, and minority status, as well as filtering by degree level, division, school/college, plan, named option, and academic year/cohort. The data visualization utilizes a Universal Program filter. Additional Info | Graduate School Office of Academic Analysis, Planning, & Assessment | Student Record | Public | Publicly Available | 11/08/2024 |
|
Pipeline of Wisconsin Public High School Graduates to UW-Madison
|
Interactive Data Visualization | Several key metrics related to the educational pipeline are provided at both the county and high school level for the graduating class of 2024-25. These metrics include: the number of Wisconsin public high school graduates, the number and percentage of these graduates who applied to UW-Madison, the number and percentage of these graduates who were admitted, and the number and percentage of the admits who enrolled in fall 2025. Additional Info | Data, Academic Planning & Institutional Research | Admissions, Student Record | Public | Publicly Available | 03/17/2026 |
Graduate School Explorer
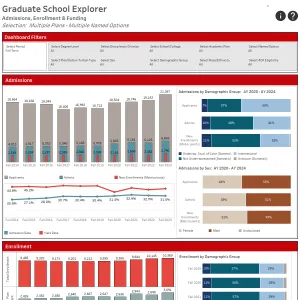
|
Interactive Data Visualization | This data visualization reports student metrics over the past ten years for degree programs in the graduate career. It provides information on student admissions, enrollment, funding, degrees, program completion, and career outcomes. Additional Info | Graduate School Office of Academic Analysis, Planning, & Assessment | Student Record | Restricted |
Specific Audience
Request Access |
04/02/2026 |
|
Graduate School Admissions & Enrollment
|
Interactive Data Visualization | This data visualization reports summary information on UW-Madison graduate program admissions and enrollment for the past five academic years. It includes data on admissions selectivity and yield rates, the demographics of applicants and enrolled students, as well as the home state or country of enrolled students. Additional Info | Graduate School Office of Academic Analysis, Planning, & Assessment | Admissions, Student Record | Public | Publicly Available | 06/15/2026 |