Fiscal Year
| Definition |
|---|
|
A period that an organization uses for accounting purposes and preparing financial statements. For the university, the fiscal year is from July 1 - June 30 (i.e., FY2016 = July 1, 2015 to June 30, 2016). Summer is the first term in the university fiscal year. |
| Data Cookbook URL (requires authorization) |
| https://uwmadison.datacookbook.com/institution/terms/174813/versions/241405 |
| Data Domain(s) |
| Finance |
Related Dashboards
| Name | Type | Description | Responsible Office | Data Domain | Classification | Access Restrictions | Last Updated |
|---|---|---|---|---|---|---|---|
|
|
Additional Info | 07/16/2026 | |||||
Salary Funding IDE
|
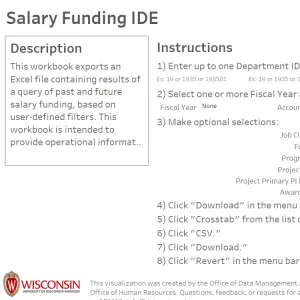
Institutional Data Exporter (IDE) | An export of salary data for both the past (payroll) and the future (projection). Data is displayed by job, project, pay period, HRS distribution percentage, funding source, etc. Additional Info | Office of Human Resources | Employee Record | Internal |
Employee Record Data - Internal
Request Access |
11/23/2022 |
|
|
Additional Info | 07/16/2026 | |||||
|
Postdocs at UW-Madison
|
Interactive Data Visualization | This data visualization provides information on the background characteristics of postdocs at UW-Madison, their average time spent in postdoctoral training, and their employment outcomes after leaving their postdoc appointment at UW-Madison. It was developed as part of the Coalition for Next Generation Life Science initiative (CNGLS). UW-Madison is a founding member of the Coalition for Next Generation Life Science, which includes 55 national research universities and schools of medicine. The Coalition seeks to improve transparency related to career prospects and opportunities for life sciences trainees, including both graduate students and postdocs. Additional Info | Graduate School Office of Academic Analysis, Planning, & Assessment | Employee Record | Public | Publicly Available | 09/19/2023 |
|
Department Planning Profiles: Budget
|
Interactive Data Visualization | This interactive visualization provides budget summary data for UW-Madison going back to FY 1994-95. New data is added once per year after the budget cycle is completed and the budget is locked. Additional Info | Data, Academic Planning & Institutional Research | Budget | Internal |
All UW-Madison Employees
Request Access |
10/31/2023 |
Programs for Non-Traditional Audiences
|
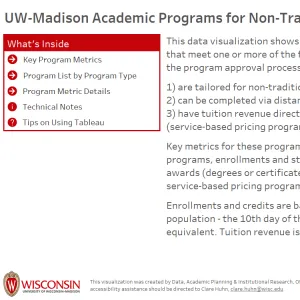
Interactive Data Visualization | Enrollments, credits, awards, and tuition revenue for the academic programs included in the workbook. Additional Info | Data, Academic Planning & Institutional Research | Academic Planning, Student Record | Internal |
All UW-Madison Employees
Request Access |
09/11/2024 |
|
Graduate Program Profiles - Graduate Student Funding
|
Interactive Data Visualization | This data visualization provides information about the financial support of graduate students at UW-Madison, including the percentage of fully funded students, their funding appointment types, and average monthly stipend levels. The data visualization utilizes a Universal Program filter. Additional Info | Graduate School Office of Academic Analysis, Planning, & Assessment | Financial Aid, Student Record | Public | Publicly Available | 10/14/2024 |
|
Graduate Program Profiles - Doctoral Career Outcomes
|
Interactive Data Visualization | This data visualization provides information on the early, mid, and late career outcomes of UW-Madison doctoral program alumni using a Universal Program filter. Reported data include employment status, job sector and location, and jobs in academia. Additional Info | Office of Academic Analysis, Planning and Assessment - Graduate School | UW Madison Enterprise | Public | Publicly Available | 10/14/2024 |
|
Graduate Program Profiles - Completion & Degrees
|
Interactive Data Visualization | This data visualization reports summary information on UW-Madison graduate program degrees, time-to-degree, completion rate, retention rate, and completion over time for the past four three year cohorts of Master's and Doctoral students. It includes breakdown by sex, citizenship status, and minority status, as well as filtering by degree level, division, school/college, plan, named option, and academic year/cohort. The data visualization utilizes a Universal Program filter. Additional Info | Graduate School Office of Academic Analysis, Planning, & Assessment | Student Record | Public | Publicly Available | 11/08/2024 |
Payroll Funding Edit & Placeholder IDE
|
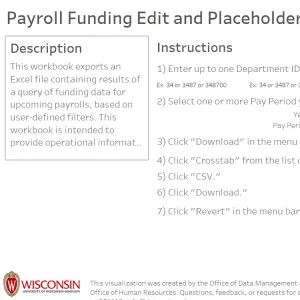
Institutional Data Exporter (IDE) | An export of employee jobs and the respective upcoming payroll funding projections for a given Deptid(s) and Pay Period(s). Additional Info | Office of Human Resources | Employee Record | Internal |
Employee Record Data - Internal
Request Access |
03/31/2025 |
Accounts Receivable and Billing Dashboard
|
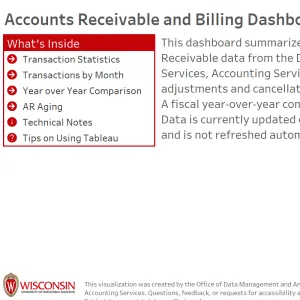
Interactive Data Visualization | This dashboard summarizes and displays Accounts Receivable data received from Accounting Services at the Division of Business Services. This includes adjustments and cancellations, as well as write-offs. A fiscal year-over-year comparison is also available. Data is currently updated on an Excel sheet in Box and is not refreshed automatically. Additional Info | Division of Business Services | Finance | Internal |
Specific Audience
Request Access |
05/12/2025 |
|
Budget - Source of Funds
|
Interactive Data Visualization | This workbook shows budget data by fund, fund category, program code, and major class. This budget data is the submitted and approved budget by UW-Madison and UW System and does not include budget transfers, adjustments, and in-the-year edits. Additional Info | Madison Budget Office | Budget | Internal |
Specific Audience
Request Access |
01/30/2026 |
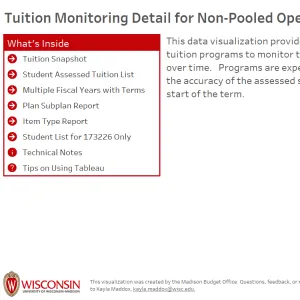
Tuition Monitoring Detail for Non-Pooled Operations
|
Interactive Data Visualization | This Tableau workbook provides charts and tables of non-pooled tuition revenue and students as of the summer of 2013 (fiscal year 2013-14). Users have multiple options for filtering data such as academic plan and subplan, tuition residency, term and item type. Data download options include images, text files, crosstabs and PDFs. Additional Info | Madison Budget Office | Budget | Restricted |
Specific Audience
Request Access |
02/05/2026 |
|
NSF HERD Research Expenditures
|
Interactive Data Visualization | This visualization shows research expenditures data from the National Science Foundation's annual Higher Education Research and Development (HERD) survey. Data can be broken down, at several levels of aggregation, by funding source and field. Additional Info | Data, Academic Planning & Institutional Research | UW Madison Enterprise | Internal |
All UW-Madison Employees
Request Access |
03/13/2026 |
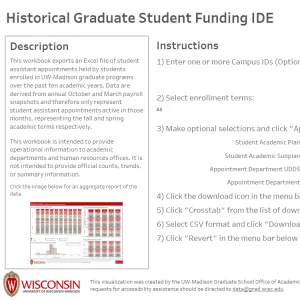
Historical Graduate Student Funding IDE
|
Institutional Data Exporter (IDE) | This workbook exports an Excel file of student assistant appointments held by students enrolled in UW-Madison graduate programs over the past ten academic years. Data are derived from annual October and March payroll snapshots and therefore only represent student assistant appointments active in those months. Additional Info | Graduate School Office of Academic Analysis, Planning, & Assessment | Employee Record, Student Record | Restricted |
Employee Record Data - Internal, Student Record Data - Restricted
Request Access |
04/02/2026 |
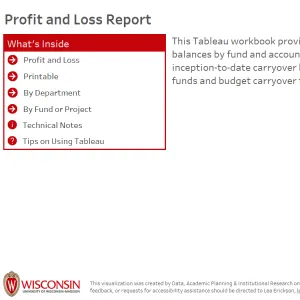
Profit and Loss Report
|
Interactive Data Visualization | The workbook provides year to date detailed fund balances by fund and account category. It also provides inception to date carryover balances for Program Revenue (PR) funds and budget carryover for General Purpose funds (GPR). Additional Info | Division of Business Services | Finance | Internal |
Specific Audience
Request Access |
05/05/2026 |
|
|
Additional Info | 07/16/2026 | |||||
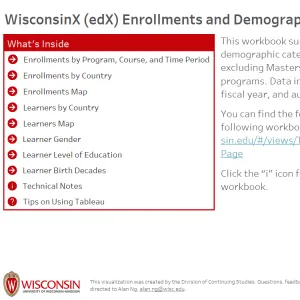
WisconsinX (edX) Enrollments and Demographics
|
Interactive Data Visualization | This workbook summarizes enrollments and demographic categories in all WisconsinX courses excluding Masters enrollment in for-credit courses and programs. Data includes breakdowns by program, fiscal year, and audit vs. verified tracks. Additional Info | Division of Continuing Studies | Student Record, UW Madison Enterprise | Internal |
All UW-Madison Employees
Request Access |
05/15/2026 |